How to Analyze A/B Test Results for Ads
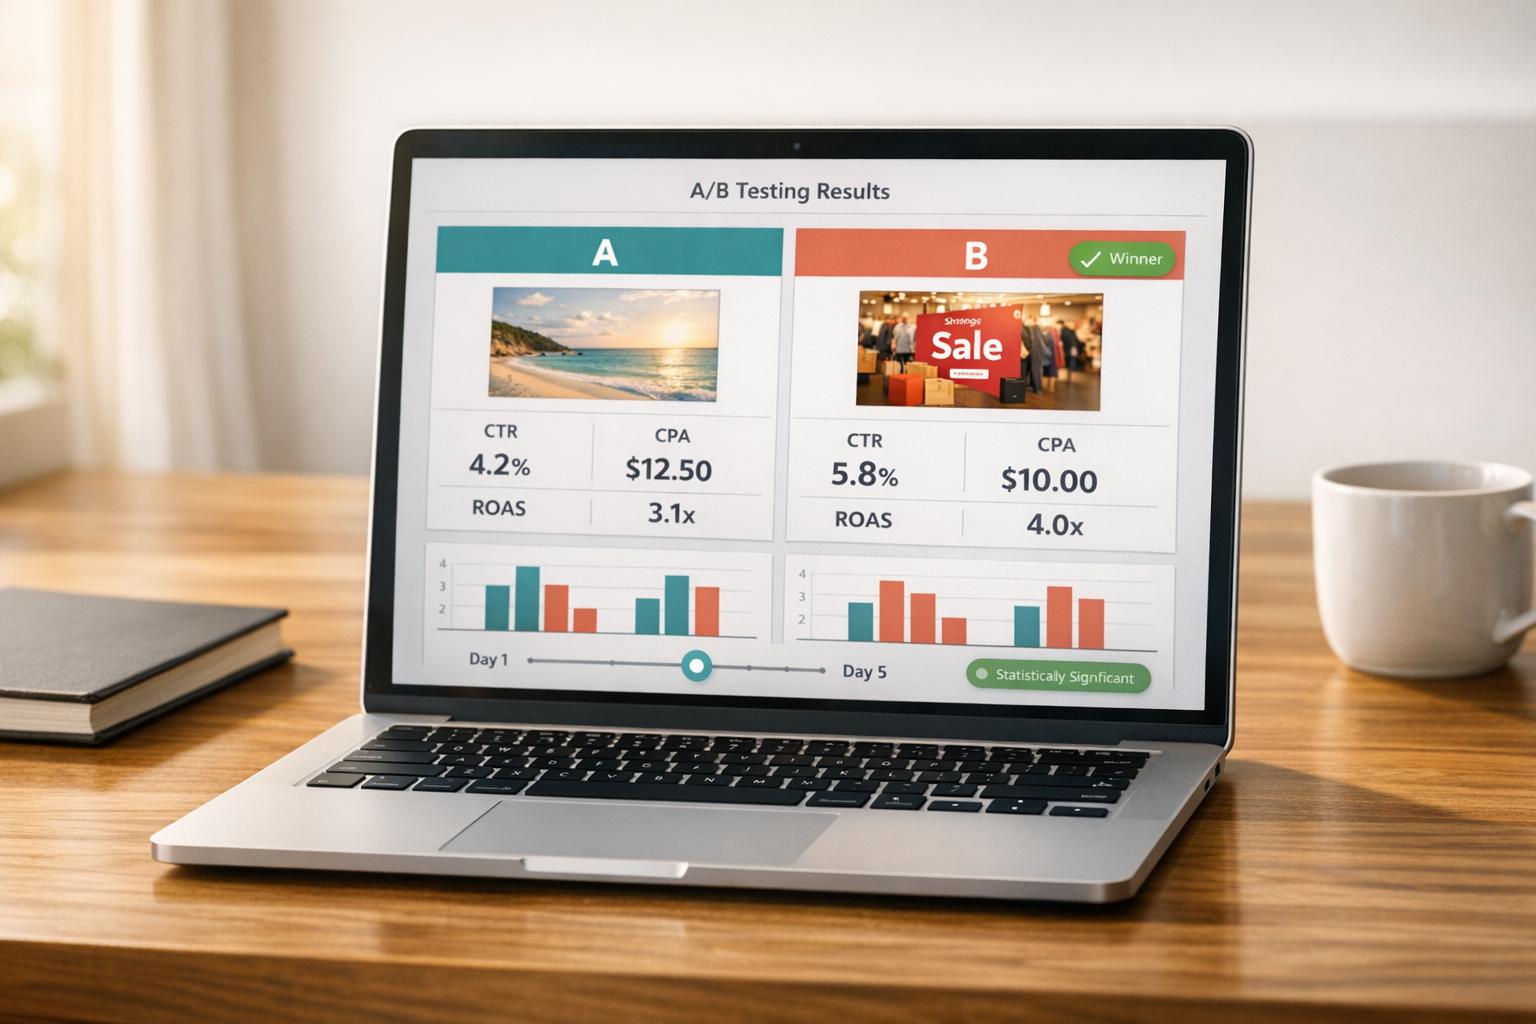
How to Analyze A/B Test Results for Ads
Running A/B tests on Meta Ads is the best way to improve performance and spend your budget effectively. By comparing two ad versions with one variable change, you can identify what drives better results. The key? Test one element at a time and focus on metrics that align with your goals. Here's a quick overview:
- Primary Metrics: CTR (attention), CPC (cost per click), CPA (cost per conversion), ROAS (revenue per ad spend), and Conversion Rate.
- Secondary Metrics: Engagement Rate, Ad Frequency, Video Completion Rate, and Landing Page Metrics (e.g., Bounce Rate, Session Duration).
- Steps to Analyze:
- Ensure statistical significance (90% confidence level minimum).
- Run tests for at least 4–7 days to stabilize data.
- Compare key metrics to determine the winning variant.
- Apply insights across campaigns and document what works.
Avoid common mistakes like insufficient sample sizes, testing too many variables at once, or ending tests prematurely. A data-driven approach ensures better decision-making and long-term ad performance.
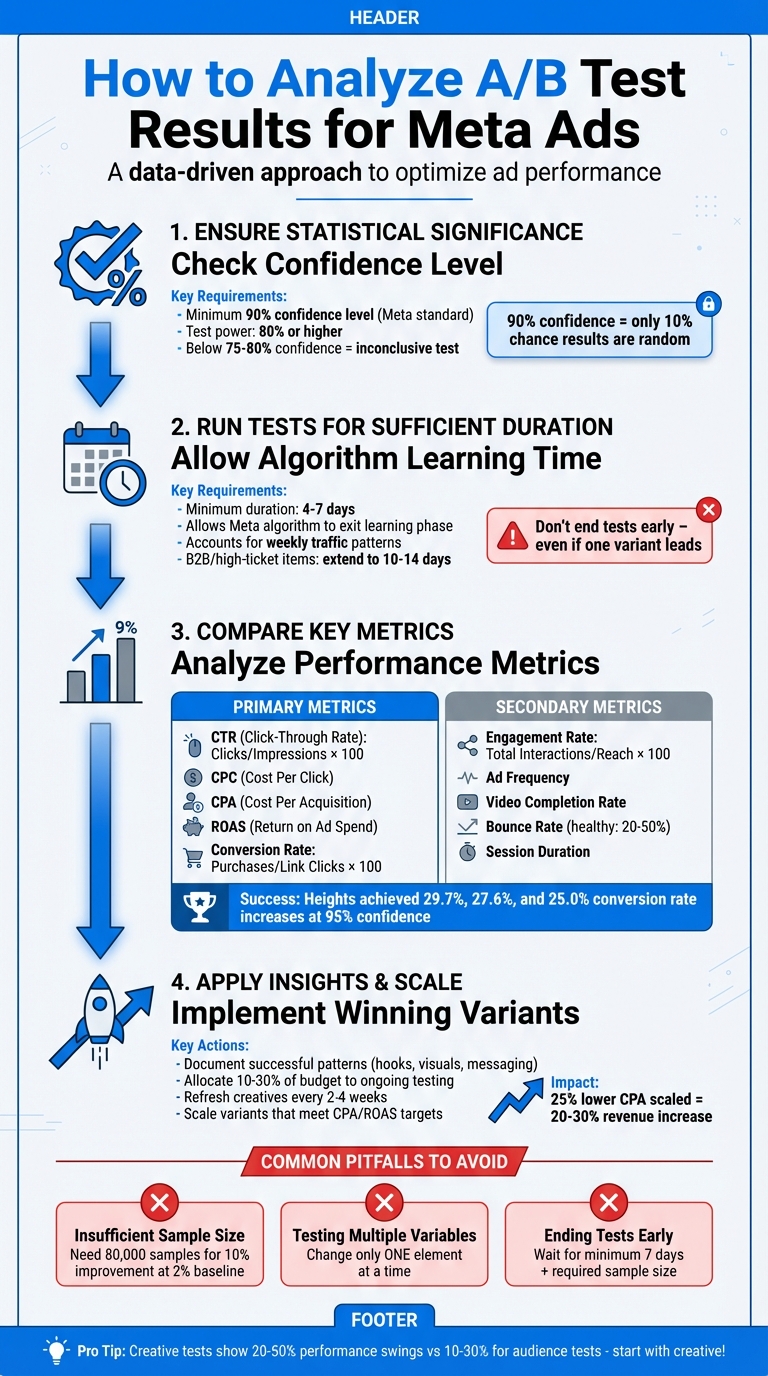
4-Step Process to Analyze A/B Test Results for Meta Ads
Key Metrics to Analyze A/B Test Results
When analyzing A/B test results, it's crucial to focus on metrics that align with your campaign goals. Whether your objective is driving sales, generating leads, or increasing brand awareness, the right metrics will provide the insights you need.
Primary Metrics to Measure
Click-Through Rate (CTR) is a key indicator of how well your ad captures attention. It's calculated as (Clicks / Impressions) × 100. Think of CTR as a creative checkpoint - it evaluates how well your ad's message and visuals resonate before external factors like landing page performance come into play [4]. A low CTR often points to issues within the ad itself rather than what happens after the click.
Cost Per Click (CPC) tells you how much you're paying for each click, while Cost Per Acquisition (CPA) measures the cost of each conversion - whether that's a purchase, sign-up, or lead. For e-commerce campaigns, Return on Ad Spend (ROAS) and CPA should take priority over metrics like engagement or CTR [1]. ROAS, in particular, reveals how much revenue you generate for every dollar spent on ads.
Conversion Rate is another essential metric, calculated as (Purchases / Link Clicks) × 100. It highlights how effectively your campaign turns clicks into actions. For example, Heights used Meta Ads to test different copy angles, achieving conversion rate increases of 29.7%, 27.6%, and 25.0% at a 95% confidence level [4].
While these metrics directly measure performance, secondary metrics can provide additional context about user behavior and ad longevity.
Secondary Metrics to Consider
To gain a deeper understanding of your ad's performance, consider tracking these secondary metrics alongside the primary ones. For instance, while ROAS measures financial success, engagement rate - calculated as (Total Interactions / Reach) × 100 - shows how your audience is responding. High shares and saves indicate strong content appeal, while comments suggest active participation.
Ad frequency measures how often the average person sees your ad. If frequency becomes too high, it may signal creative fatigue, leading to audience oversaturation and rising costs. Keeping an eye on this metric helps you know when to refresh your creative. For video ads, Video Completion Rate reveals how many viewers watch your ad all the way through, while Relevance Score offers immediate feedback on how well your ad resonates. Higher relevance scores typically mean better delivery and lower costs.
Finally, monitor landing page metrics like bounce rate and session duration to ensure your ad's promise matches the post-click experience. A bounce rate between 20% and 50% is considered healthy; anything above 50% may indicate a disconnect. For context, apparel and footwear brands average a 27.92% bounce rate, while SaaS companies average closer to 48.24%. Median session durations are about 92.33 seconds for B2C companies and 77.61 seconds for B2B. Be aware that increasing page load times from 1 to 3 seconds can raise bounce rates by 32%.
"Engagement is the metric that we look at the most. If we are reaching and interacting with people, that typically hits the goal for our customers."
– Patrice Valentine, ProFusion Web Solutions
sbb-itb-db0d145
How to Interpret A/B Test Results
Once your test wraps up, Meta's Experiments tool in Business Suite makes it easy to review key performance metrics. One of its standout features is the confidence level, which indicates how likely your results would replicate if you ran the test again [2][5]. With this data in hand, you're ready to dive into interpreting the results and drawing actionable conclusions.
Check for Statistical Significance
Meta uses a 90% confidence level as its standard for identifying a winning variant [4]. Essentially, this means there’s only a 10% chance that the results are due to random variation instead of a true performance difference.
"Meta defaults to 90% significance, probably because it optimizes for speed over precision, so you'll get directional learnings faster." – Daphne Tideman, Growth Advisor [4]
For reliable results, ensure the confidence level is at least 90% and the test power reaches 80% or higher [2]. If confidence dips below 75–80%, the test likely ends in a tie, suggesting the variable you tested didn’t create a noticeable impact [2].
Timing is just as critical as sample size. Let your test run for 4 to 7 days to allow Meta’s algorithm to exit the learning phase and stabilize the data [2]. Cutting a test short - even if one variant seems to be ahead - can lead to premature conclusions, as the data may still be shifting [2].
Isolate Performance Variables
When testing, change only one element at a time. Whether it’s a headline, an image, or a call-to-action button, keeping everything else constant ensures that any performance differences can be traced back to that specific change [2]. Testing multiple elements simultaneously can cloud the results and make it harder to pinpoint what drove the outcome [2].
Creative elements often deliver the most dramatic results, with performance swings ranging from 20% to 50%. In contrast, audience tests typically show smaller differences, around 10% to 30% [1]. This makes creative testing a great starting point for maximizing impact. Meta’s Experiments tool also helps prevent audience overlap, ensuring cleaner results [2].
If your test doesn’t produce a clear winner, it may mean the tested variable wasn’t impactful enough. In such cases, consider testing a more dramatic or unconventional idea - a "big swing" concept [2].
Compare Key Metrics Between Variants
To determine the winning variant, focus on the metric that aligns with your campaign’s primary objective. For instance, prioritize Cost per Purchase for sales campaigns or Cost per Lead for lead generation efforts. Meta simplifies this process by automatically declaring a winner based on the key metric selected during the test setup [2].
While the primary metric is crucial, don’t overlook secondary data points. For example, if a lower Cost per Purchase is paired with a sharp drop in CTR, it might signal an issue with your creative. Custom metrics, like Conversion Rate, can provide additional insights to fine-tune your analysis [4].
An example from 2023 demonstrates this approach in action. Heights used Meta A/B testing to validate copy angles for their ads before applying changes to their website. By focusing on CTR as a leading metric, they reduced the risk of poor messaging decisions. Subsequent website experiments, pre-validated through Meta, delivered statistically significant performance lifts of 29.7%, 27.6%, and 25.0%. In contrast, earlier tests without this validation led to non-significant drops of 9.1% and 9.4% [4].
Lastly, analyze how your results vary across segments like demographics, devices, or placements. A variant might perform well overall but fall short with a specific age group or on mobile devices. These insights can guide adjustments to your targeting and creative strategies in future campaigns.
Scaling and Optimizing Based on Results
Apply Learnings Across Campaigns
Once you've identified what works through statistical significance and metric comparisons, the next step is applying those insights to future campaigns. For example, if "speed-focused" headlines consistently outperform "quality-focused" ones, that messaging approach should guide your strategy moving forward [6]. The key is turning individual test results into a broader creative framework.
To make this easier, create a pattern library documenting successful hooks, visuals, and messaging angles. This way, you’re not starting from scratch each time but building on proven strategies [6][7]. For instance, if benefit-driven messaging routinely outshines problem-focused copy, use that as a foundation for your next creative iterations [6][1].
Dedicate 10%-30% of your ad budget to ongoing testing. This ensures you’re always uncovering fresh winners before your current creatives lose their impact, which typically happens after 2-4 weeks [6][1]. A two-tier system works well: one campaign for testing new concepts and another for scaling proven ones. This separation prevents budget overlap and keeps your data clean [6].
Even top-performing creatives should be re-evaluated to confirm they maintain their effectiveness over time.
When to Retest or Refine
After scaling a successful variant, it’s important to continue monitoring its performance. Not every winner is worth scaling further. If a variant meets initial success but fails to hit your target CPA or ROAS, it’s a sign to refine the messaging or explore entirely new concepts rather than doubling down on an underperformer.
Plan for creative updates every 2 to 4 weeks, depending on your audience size and frequency metrics. A rising frequency paired with a drop in CTR often signals that your creatives are losing their appeal [6][1]. Keep an eye on thumb-stop rates and CTR as early indicators while waiting for conversion data to fully materialize [6]. Documenting both your successes and failures provides valuable insights into what resonates with your audience [6].
For those seeking expert support, Dancing Chicken can help fine-tune your Meta Ads strategy, ensuring sustainable growth and consistent results.
Common Pitfalls in A/B Test Analysis
Avoiding common mistakes in A/B test analysis is crucial to ensure your conclusions are accurate and your budget is well-spent. Missteps in this process can invalidate even the most well-designed tests, leading to wasted resources and misleading insights. Let’s break down three common errors to watch out for.
Insufficient Sample Sizes
Not having enough data is a fast track to unreliable results.
"Running A/B tests without the right sample size is like flipping a coin twice and declaring the result meaningful."
– Dr. Sarah Mitchell, Statistical Analysis Lead [8]
When sample sizes are too small, it becomes easy to either miss real improvements or falsely declare a winner due to random noise [8][1].
Before launching any test, calculate the required sample size using a few key inputs: your baseline conversion rate, the minimum detectable effect (MDE), the desired statistical significance (usually 95%), and statistical power (typically 80%) [8][1]. This ensures you're accounting for a 5% chance of random error while maintaining an 80% likelihood of detecting real changes [8][1].
Here’s an example:
- If your baseline conversion rate is 2% and you're aiming for a 10% improvement, you'll need around 80,000 samples per variation.
- For a larger 50% improvement, you’d only need about 3,200 samples per variation [1].
Setting an unrealistically high MDE - like expecting a 50% jump in performance - is a common mistake. Instead, aim for achievable improvements of 10-20% [8].
Also, if your campaigns generate fewer than 200 conversions per month, formal A/B testing might not be feasible yet [9]. For tests involving multiple variations, apply the Bonferroni correction to adjust your significance level and reduce the risk of false positives [8].
Testing Too Many Variables
Testing multiple changes at once makes it impossible to pinpoint what actually caused the results.
"If you change the headline, the ad creative, and the audience all at once, you'll have no idea which change was responsible for the different results. Your data will be muddled and meaningless."
– Graphed [2]
To avoid this, keep everything consistent - budget, audience, placement - except for the one variable you're testing [3][2]. Creative elements, like visuals or messaging, are often a good starting point since they tend to drive the biggest performance shifts [1].
For more complex optimizations, use a sequential approach. Start broad (e.g., testing creative concepts), then refine specific elements like hooks or headlines based on what works [1]. If you need to test multiple variables at once, consider a multivariate test. This method evaluates all possible combinations (e.g., AX, AY, BX, BY) but requires more time, budget, and data to yield reliable insights [1].
Ending Tests Too Early
Drawing conclusions too soon is another common pitfall. Tests need enough time to gather meaningful data.
Meta recommends running A/B tests for at least 7 days to allow for algorithm learning and to account for weekly traffic patterns [3]. If your product or service has a longer conversion cycle - common in B2B or higher-ticket items - consider extending the test to 10 or 14 days to capture delayed conversions [3].
The key is patience. Wait until your test reaches both the required sample size and the minimum duration before making decisions. Building campaigns on rushed or incomplete data will only hurt performance in the long run.
Conclusion
A/B testing provides a clear roadmap for improving your Meta Ads campaigns over time.
By analyzing test results, you can develop a system grounded in data to refine ad performance. Focusing on key metrics like CTR and cost per purchase, ensuring statistical significance, and testing just one variable at a time allows you to replace guesswork with actionable insights that directly contribute to better results.
Once you've identified winning strategies, scaling them is the next step toward growth. For example, an ad set with a 25% lower CPA scaled across campaigns could lead to a 20–30% revenue increase. This approach involves pausing underperforming ads and reallocating your budget toward those that consistently deliver results - turning your Meta Ads into a powerful revenue generator.
At the same time, it's essential to steer clear of common errors. Testing with insufficient sample sizes, changing multiple variables at once, or stopping tests too early can produce misleading results and waste your budget. A patient, methodical approach ensures you avoid these costly mistakes.
The beauty of continuous testing lies in its compounding benefits. Small, incremental improvements from each test add up over time, leading to measurable growth. Whether you're tweaking ad creatives or experimenting with new audience segments, sticking to these principles ensures your campaigns stay competitive and profitable.
FAQs
How do I choose the one metric that decides the winner?
When deciding on the key metric for your A/B test, pick one that directly ties to your campaign goals. For instance:
- CTR (Click-Through Rate) works well if you're measuring engagement.
- CVR (Conversion Rate) or ROAS (Return on Ad Spend) are ideal for tracking conversions.
- CPA (Cost Per Acquisition) is a solid choice for assessing cost efficiency.
Choose the metric that best represents your objectives, and ensure your results are backed by statistical significance to confidently identify the winner.
What if my test shows no clear winner?
If your A/B test doesn’t reveal a clear winner, don’t jump to conclusions. Start by ensuring the test ran for an adequate period - typically between 7 and 30 days - to gather enough data. Look for consistent trends or signs of results leveling off across different user segments. It’s also crucial to set clear criteria before starting, such as reaching a 95% confidence level and achieving the required sample size. If the results are still inconclusive, consider tweaking the variables, expanding the sample size, or running further tests to dig deeper into the data.
How much budget should I set aside for ongoing testing?
To conduct effective A/B tests for Meta Ads, set aside a portion of your monthly ad budget specifically for testing. It's crucial to ensure each variation gets enough funding to generate statistically reliable results. Typically, these tests run for 7–30 days to provide actionable insights. The exact budget will vary based on your goals, audience size, and total ad spend. The key is to strike a balance - collect enough data without exceeding your budget.