Meta Ads: How Regional Copy Tests Guide Expansion

Meta Ads: How Regional Copy Tests Guide Expansion
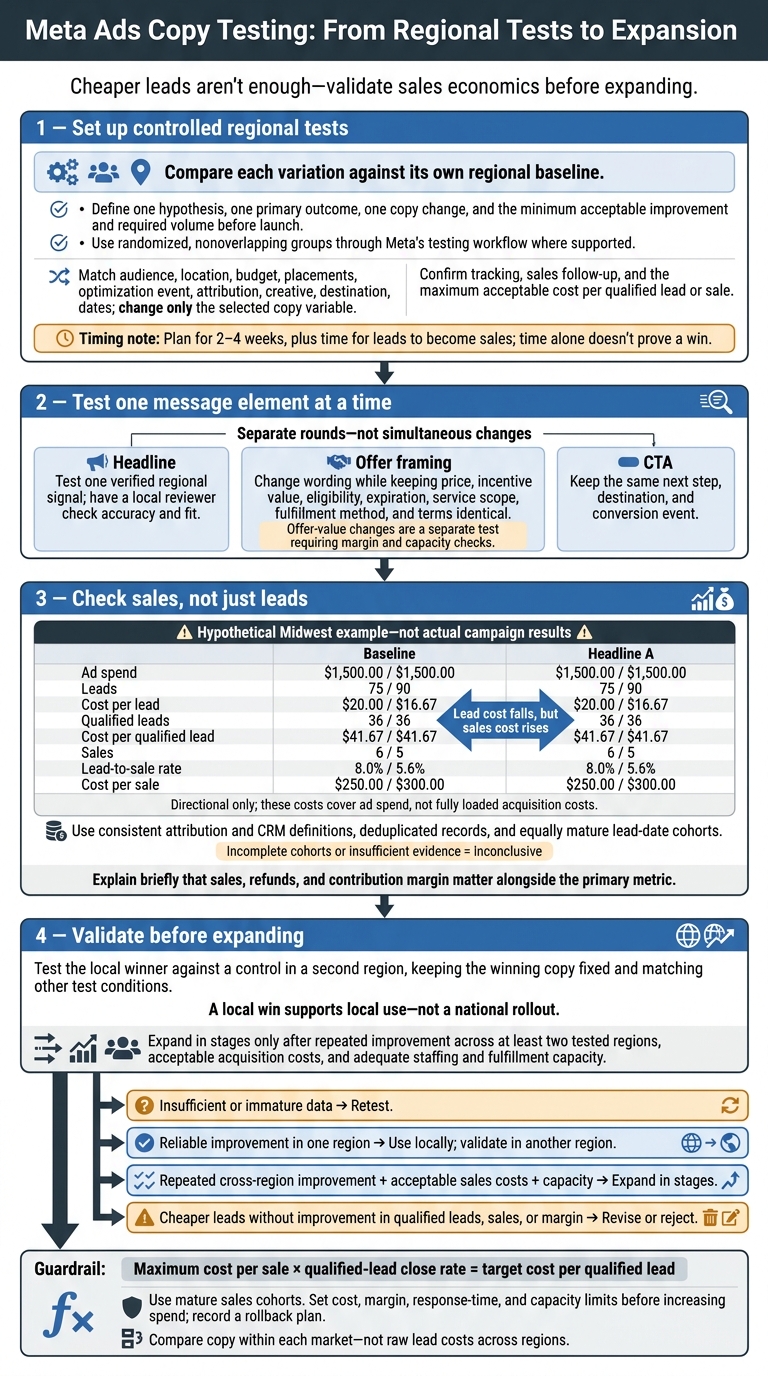
I’d test copy within each region before using it to guide expansion. Compare one headline, offer, or CTA change against a local control - not one market’s raw lead costs against another’s.
Here’s the process I’d use:
- Set the limits: Confirm tracking, sales follow-up, and your maximum cost per qualified lead or sale.
- Test one change: Keep other settings matched and audiences separate. Plan for 2–4 weeks, plus time for leads to become sales; time alone doesn’t prove a win.
- Check sales, not just leads: In the article’s hypothetical Midwest example, lead cost falls from $20 to $16.67, but cost per sale climbs from $250 to $300.
- Validate before expanding: Test the local winner against a control in another region. Increase spend in stages only when sales costs, margins, and staffing support it.
My rule: cheaper leads aren’t enough. <u>Expand only when tested copy brings sales at a cost your business can afford.</u>
Meta Ads Copy Testing: From Regional Tests to Expansion
Step 1: Set Up Copy Tests Within Each Region
Once you’ve set market goals, test one copy variable within each region.
Use Meta Ads Manager’s A/B Test option or Experiments workflow, where available, to compare your baseline against one copy variation in randomized, nonoverlapping groups.[3][2] Run both versions in each region so regional differences don’t produce a false winner.
Match Audience and Delivery Settings
Duplicate the baseline and change only the copy element you’re testing. Keep the test structure the same in every regional cell.
| Test element | Keep fixed | Permitted change |
|---|---|---|
| Audience | Age range, gender settings, custom/lookalike audience, exclusions, and targeting expansion choices | None |
| Location | Region, postal codes, radius, and location-presence setting | None |
| Campaign and delivery | Objective, conversion location, optimization event, attribution, bid strategy, placements, budget amount and method, schedule, and test dates | None |
| Creative and destination | Image or video, format, branding, landing page, and form | One headline, offer wording, or CTA change |
| Measurement | Primary conversion event and reporting window | None |
Check the account’s location controls. City or state targeting doesn’t necessarily mean resident-only delivery. After launch, review the available breakdowns for geography, age, device, placement, spend, and frequency. Matching settings doesn’t guarantee matching exposure.
Document other active campaigns and prevent overlapping test exposure wherever possible.
Define the Hypothesis and Test Limits
Before launch, define the target audience, copy change, expected lift, primary outcome, minimum acceptable improvement, and required volume. Build the hypothesis around a message you could use across regions.
Use recent regional results and power calculations to estimate your chance of detecting the target lift.[4] Set a fixed test window and treat short-term lifts as provisional.[1][4]
Decide in advance when you’ll make exceptions: tracking failures, policy issues, severe delivery imbalance, or clearly harmful results. Otherwise, stick to the planned duration and sample requirements.
Launch checklist
- [ ] One hypothesis, one primary outcome, and one copy change.
- [ ] Randomized audience separation through Meta’s testing workflow, where supported.
- [ ] Matched settings, documented location controls, and overlapping campaigns addressed.
- [ ] Delivery review planned, with no mid-test edits or early winner declarations.
- [ ] Stopping and retesting rules documented; low-confidence results labeled inconclusive.
With the setup locked, move to headline, offer, and CTA testing.
sbb-itb-db0d145
Step 2: Test Regional Headlines, Offers, and Calls to Action
Use this round to find which part of your regional message changes response - and which copy is worth testing in the next market.
Test Headlines for Local Relevance
Test one regional signal at a time: a city or state name, verified service area, local need, or market-specific term. Keep the core benefit, image or video, offer, CTA, audience, placements, budget, optimization event, and destination unchanged.
Have a local reviewer check accuracy, tone, and fit with local customs and expectations. Avoid stereotypes and verify claims about availability.
Start with headlines, then test offers and CTAs in separate rounds. Test primary text only when the headline can't carry the regional cue. Label all draft copy as hypothetical until it's reviewed and approved.
Once you've settled on a headline, move to offer and CTA tests.
Separate Wording Tests From Offer Tests
Rewording an offer isn't the same as changing its value. For wording tests, keep the price, incentive value, eligibility, expiration, service scope, fulfillment method, and terms identical.
Before changing the offer itself, check contribution margin after advertising, commissions, and fulfillment costs. Also check whether staffing and fulfillment capacity can support the offer.
| Test type | Changed element | Required controls | Interpretation limits |
|---|---|---|---|
| Headline | Regional wording | Same image or video, primary text, offer, CTA, audience, placements, budget, optimization event, and destination | Local winners may not work in other markets or seasons. |
| Primary-text wording | Regional cue the headline can't carry | Same headline and all other ad content, delivery, offer, and destination settings | Lift may come from clearer or shorter copy. |
| Offer-framing test | Description or framing of the same offer | Same price, incentive value, eligibility, expiration, service scope, fulfillment method, and terms | Measures framing, not offer value. |
| Offer test | Price, discount, incentive, eligibility, terms, or deadline | Same audience, ad structure, CTA, destination, fulfillment process, and measurement window | Cheaper leads may hide weaker margins, lower lead quality, or capacity limits. |
| CTA test | Editable wording or preset button label | Same surrounding copy, destination, form, confirmation flow, offer, and conversion event | Measures wording, not a different next step. |
Test Calls to Action With the Same Next Step
Use editable CTA copy or a matching preset Meta button label. The ad, button, and landing page must promise the same action.
Label each test with its region, variable, version, date, and objective. Save the exact copy, offer terms, reviewer approval, ad previews, and landing-page version with that record. Note whether the winner is local-only or a candidate for reuse in other markets, pending validation.
Before the next round
- [ ] One major change: headline, primary text, offer wording, offer terms, or CTA.
- [ ] Regional claims verified; no stereotypes or unsupported guarantees.
- [ ] Offer economics and fulfillment capacity checked.
- [ ] CTA variants use the same next step.
- [ ] Test labels consistently identify region, variable, version, date, and objective.
Step 3: Compare Lead Costs and Sales Results
Once the tests have run long enough to produce comparable cohorts, compare their costs and sales results.
Build a Regional Results Table
Apply the same measurement rules to every row. Record the attribution window, conversion event, time zone, reporting range, and extraction date. Use consistent CRM stage definitions. Group leads by lead date - not close date - and give every cohort the same maturation period, such as 60 days. Keep Meta-attributed totals separate from CRM-confirmed outcomes, and mark unfinished cohorts as provisional.[6][9]
Hypothetical figures - not actual campaign results. The table uses deduplicated CRM records, equal cohort maturity, and one attribution rule.
Region and variant Spend Impressions Leads Cost per lead Qualified leads Cost per qualified lead Sales Lead-to-sale rate Attributed revenue Cost per sale Southeast - Baseline $1,500.00 75,000 100 $15.00 40 $37.50 5 5.0% $7,500.00 $300.00 Southeast - Headline A $1,500.00 72,000 125 $12.00 45 $33.33 6 4.8% $9,000.00 $250.00 Midwest - Baseline $1,500.00 60,000 75 $20.00 36 $41.67 6 8.0% $9,000.00 $250.00 Midwest - Headline A $1,500.00 58,000 90 $16.67 36 $41.67 5 5.6% $7,500.00 $300.00
Calculate cost per lead, cost per qualified lead, lead-to-sale rate, and cost per sale from the table values. Use “Not calculable” when a denominator is zero.
These figures cover ad spend only, not fully loaded acquisition costs. Those can also include creative production, agency fees, software, sales labor, and overhead. Revenue isn't profit, either: subtract product, fulfillment, commission, refund, and other costs.
Match ad records to stable CRM lead and order IDs. Keep ad IDs, click identifiers, timestamps, and UTM fields where available. Deduplicate people and transactions. When Pixel and Conversions API report the same event, use matching event names and event IDs so Meta can deduplicate them.[6][9][10]
Separate Copy Results From Market Differences
Compare each variant with its own regional baseline first. With cost per qualified lead as the primary metric, calculate absolute change as variant minus baseline. For relative change, divide that difference by the baseline. Lower costs favor the variant, but the raw numbers don't establish a winner.[5][7]
The question is simple: did the copy change performance, or did the market?
Comparison of the hypothetical figures above.
Region Baseline Variation Absolute change Relative change Uncertainty Southeast $37.50 $33.33 −$4.17 −11.1% Directional only Midwest $41.67 $41.67 $0.00 0.0% Directional only
Compare regions only after judging each variant against its baseline. Cost per sale also depends on qualification and close rates. Cheap leads can still produce expensive sales if too few leads qualify or close.
Before crediting copy for a regional gap, check audience composition, auction CPM, placements, frequency, delivery volume, offer eligibility, sales response time, contact rate, and follow-up quality. Identical copy can produce different costs in different markets.
Check Result Reliability
Judge the primary metric alongside qualified-lead rate, sales, revenue, refunds, and contribution margin. Lead volume and cost per lead are supporting metrics - not proof of success.
Report counts and uncertainty intervals, and state the method used. Follow the planned test duration and conversion threshold instead of stopping when one variant takes an early lead. Account for multiple comparisons when testing many variants, and label secondary findings exploratory. Attributed sales don't prove true sales lift; measuring causal lift requires a suitable holdout, geo experiment, or Conversion Lift design.[5][7][8]
- [ ] Conversion volume supports the planned decision and uncertainty range.
- [ ] Sales cohorts have completed the same maturation period.
- [ ] Attribution settings, CRM definitions, cohort dates, and deduplication rules match.
- [ ] Audience, delivery, eligibility, and follow-up differences are resolved or disclosed.
Treat the strongest result as a candidate for validation, not a decision to scale.
Step 4: Validate Winning Copy Before Expansion
After Step 3, treat the best regional result as a candidate for validation - not a decision to roll out.
Decide Whether to Retest, Revise, or Expand
Validate the strongest copy before increasing spend. A local win supports local use, not a national rollout.
| Test result | Action | Next check |
|---|---|---|
| Small sample, unstable costs, few qualified leads, or incomplete sales data | Retest the promising copy against the original baseline using the same audience, budget, placement, and conversion settings | Confirm enough optimization events, lead quality, and downstream sales results before deciding |
| Reliable improvement in one region with acceptable cost per qualified lead and cost per sale | Use locally and test the same message against the baseline in a second region | Check whether the advantage holds under matched conditions. If it fails in the second region, keep it local. |
| Repeated improvement across at least two tested regions with acceptable sales costs and enough staffing and fulfillment capacity | Expand in stages | Track cost per qualified lead, cost per sale, close rate, margin, and response time during rollout |
| Lower cost per lead but no improvement in qualified leads, sales, or margin | Revise or reject | Check lead quality, offer fit, sales follow-up, and tracking rather than scaling cheap leads |
In the validation region, keep the winning copy fixed. Match the baseline on audience, budget, placements, landing page, form, optimization event, attribution, and measurement. Change only the region.[13] If the advantage disappears, treat the win as regional fit - not copy that works across markets.
Increase Spend and Track Sales Costs
Only repeated wins justify scaling your revenue with Meta ads.
Set the maximum acquisition cost before increasing spend. Use your unit economics: this ceiling should stay below the contribution margin left after fulfillment, payment fees, commissions, refunds, and other variable costs.
Then work backward: maximum cost per sale × qualified-lead close rate = target cost per qualified lead. Use current sales data from mature cohorts, not assumed close rates.
Roll out the validated message in a few markets at a time. Tie budgets to staffing and fulfillment capacity - not an automatic percentage increase. Before launch, record your ceilings for cost per qualified lead and cost per sale, minimum close rate and margin, and maximum sales response time. Set the review window and rollback plan, too.
Return to the last stable budget or control when a critical limit is breached. Review sales-based limits after cohorts mature, but address capacity problems immediately. Major edits can return Meta ad sets to learning, so avoid changing several settings while checking whether the copy’s advantage repeats.[11][12]
Keep a copy library with the approved message, where it won, validation results, and rollout decision. Label each message local winner or replicated across named regions. Retest after major changes to seasonality, targeting, pricing, offers, landing pages, forms, CRM, follow-up, sales staffing, or fulfillment capacity. Keep the prior winner as the baseline.
Conclusion: Let Controlled Tests Guide Expansion
Once a local winner passes validation, run this final check before expanding. Compare copy within each market - not raw lead costs across regions. Approve a controlled expansion only when all four conditions are met:
- Test quality: Tracking is consistent, only one variable changes, delivery is matched, and the test has enough spend and time to account for the typical conversion lag.
- Profitability: Acquisition costs stay within the preset ceiling after accounting for discounts, refunds, sales costs, and fulfillment expenses.
- Cross-market results: The local winner beats its control in another region - not just the cheapest one.
- Fulfillment readiness: Sales staffing, capacity, support, and delivery can handle the added demand.
FAQs
How can I test regional copy with a small budget?
Set aside a small share of your budget to test one element at a time, such as a headline or offer. Use Meta’s A/B testing tools to prevent audience overlap and divide the test budget evenly between variations.
Run each test for at least four to seven days before making changes. Record what you learn, then scale only the best-performing regional variations to keep spending efficient as you expand.
What if my region generates too few sales to judge results?
Don’t make decisions before you have enough data. Keep testing until results reach statistical significance, typically at a 95% confidence level with a p-value of 0.05 or less.
If sales volume remains low, check click-through rate, cost per click, or cost per lead. Broader audience targeting can increase your sample size. But validate results by region to compare efficiency without mistaking audience differences for copy effects.
How should I choose the next region for validation?
Choose regions based on audience behavior, demographics, and competition. Underserved areas often cost less to acquire customers in than saturated markets. Track cost per acquisition (CPA) and return on ad spend (ROAS) to assess profitability, then shape your messaging around local interests, lifestyles, and values.
Before scaling, run A/B tests in your target regions. Account for seasonality and preferences tied to local customs and traditions.