
Why Does ROAS Drop When Scaling Lookalike Audiences?

Why Does ROAS Drop When Scaling Lookalike Audiences?
ROAS can drop when lookalike spending grows because ads reach less likely buyers or show too often to the same people. But before cutting spend, compare results under the same attribution window and give purchases time to show up.
The next move depends on profit - not ROAS alone. For example, a 40% contribution margin means break-even ROAS is 2.5×, before fixed costs.
- Check the cause: Review frequency, CTR, purchase rate, CPM, audience overlap, and seed quality.
- Check the data: Review budget edits, conversion delays, and uneven spending across audience tiers. Match Meta results against backend orders.
- Act on mature results: Hold profitable spending, trim added spend that misses targets, or move budget to a tested tier with room to grow.
Test broader lookalikes separately so the existing setup remains a comparison point. Let CPA, added profit, and cash flow guide each budget change.
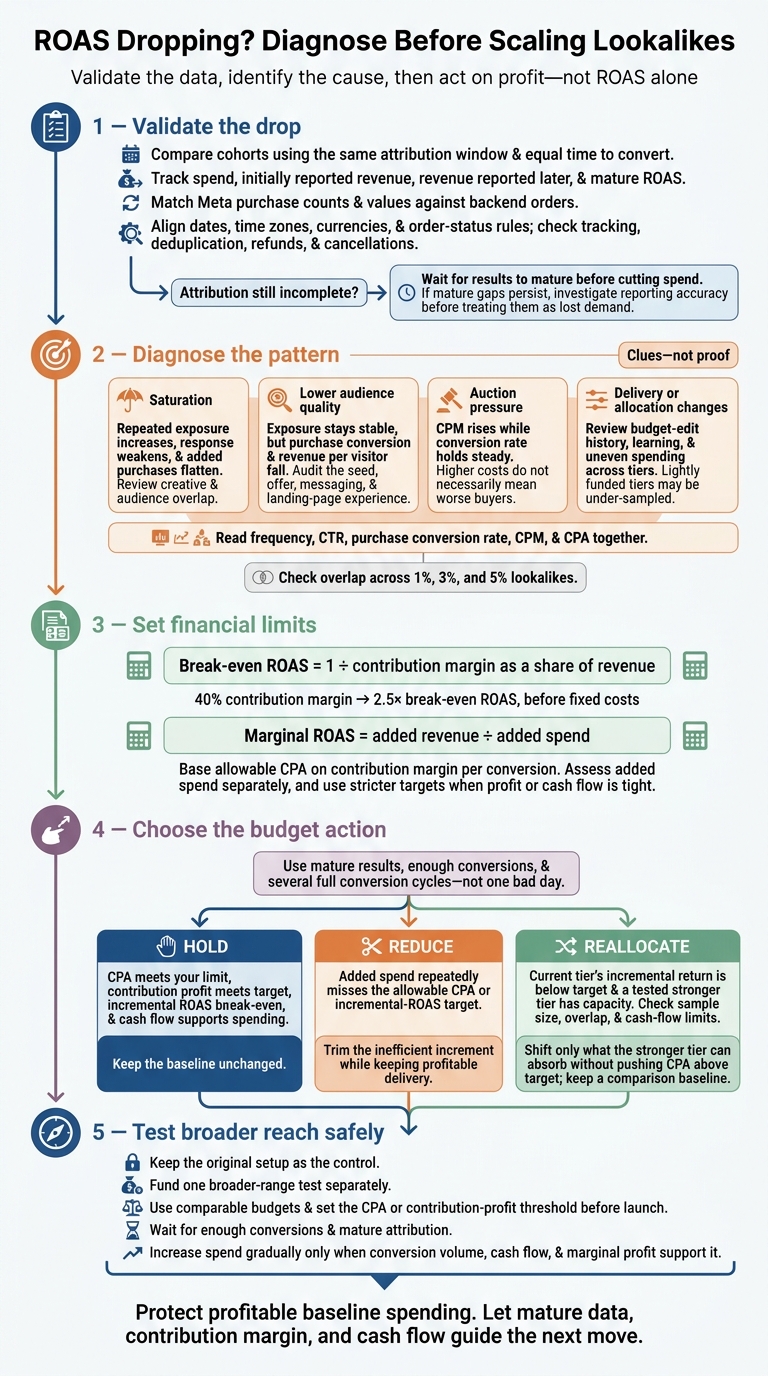
ROAS Dropping? Diagnose Before Scaling Lookalikes
Audience Saturation vs. Lower Audience Quality
Saturation means repeated exposure is producing weaker results. Lower audience quality means your ads are reaching people who are less likely to buy. Smaller lookalike percentages usually match the seed audience more closely.[6] Check whether the seed meets eligibility requirements and how recent it is.[1][5] For a fast diagnosis, look at which metric changes first.
Treat these patterns as clues - not proof - when separating fatigue, weak traffic, and reporting noise.
| Pattern | Observable signals | Likely cause | Practical response |
|---|---|---|---|
| Saturation | Repeated exposure increases, response weakens, and added purchases flatten | Repeated exposure is reaching less-responsive users | Update ad content, review overlap, and hold or reduce spend |
| Lower audience quality | Exposure stays stable, but fewer visitors buy and revenue per visitor falls | Less qualified traffic or a weak seed | Audit the seed, offer, and messaging; compare audience tiers |
| Delayed conversions | Recent results improve as later purchases arrive | Purchases lag behind clicks or impressions | Compare cohorts with equal time to convert before cutting budgets.[3] |
Metrics That Help Diagnose Audience Problems
Read frequency, CTR, purchase conversion rate, CPM, and CPA together. Rising frequency matters only when CTR, purchase rate, or CPA also worsens. Falling CTR suggests fatigue. Stable CTR paired with weaker purchase conversion can point to traffic quality, landing-page friction, a weak offer, or delayed conversions. If CPM rises while conversion rate holds steady, auction pressure - not worse buyers - may be the cause.
Check overlap across 1%, 3%, and 5% lookalikes. People may see ads repeatedly across ad sets even when frequency looks acceptable within each one. That can look like saturation before the audience is exhausted. Compare tiers using the same ad content, optimization event, placements, budget method, exclusions, and attribution window.
If these signals tell different stories, check whether budget changes or reporting lag distorted the result.
sbb-itb-db0d145
How Learning, Reporting Delays, and Spend Allocation Affect ROAS
Budget Changes and Learning
If ROAS dropped after you scaled spending, check whether the change reset delivery. Major edits to targeting, ad creative, or the optimization event - or a large budget increase - can alter delivery and trigger another learning period.[7][11] Review edit history and purchase volume. Record each change date, test one major variable at a time, and avoid overlapping edits.
Treat 50 optimization events as a diagnostic benchmark, not a spending target.[8][11][12] Check event volume, cost per event, and conversion quality. Don’t spend more just to hit that number.
If delivery changed after an edit, check whether reporting lag - not audience quality - explains the drop.
Conversion Delays and Reporting Accuracy
Compare mature spend cohorts using the same attribution window. Use click-to-purchase and impression-to-purchase delays to judge when results are ready for review. For each cohort, track spend, initially reported revenue, revenue reported later, and mature ROAS. Purchases may receive ad credit later if they occur within the selected attribution period.[13]
Match Meta purchase counts and values against backend orders. Use the same dates, time zones, currencies, and order-status rules. Check browser and server event firing, event-ID deduplication, missing purchase values, refunds, and cancellations. Also confirm whether revenue includes tax, shipping, and discounts.
Attribution differences can explain some gaps.[2] But gaps that persist in mature periods need investigation.
If mature results still lag, compare spending across audience tiers.
Uneven Spending Across Audience Tiers
If frequency and CTR don’t explain the drop, budget allocation may be the cause. Meta’s shared campaign budget doesn’t split spending equally. It favors predicted opportunities and available inventory.[9]
Review each ad set’s spend, purchase count, CPA, mature ROAS, and contribution margin together. Treat lightly funded tiers as under-sampled: they may not have enough data for a sound comparison. The tier with the most spending can generate the most purchases without delivering the best incremental profit.
When equal exposure matters, use controlled ad set budgets or an experiment before moving money toward apparent winners.[9][10] This helps test whether budget allocation, rather than audience quality, is distorting ROAS.
When to Hold, Reduce, or Reallocate Budget
If performance is still down after attribution matures, use profit thresholds to decide whether to hold, reduce, or shift budget.
Set your financial limit before changing spend. Base your allowable CPA on contribution margin per conversion: revenue per conversion minus product cost, shipping, payment-processing fees, fulfillment, expected returns, discounts, and other variable costs. Break-even ROAS is 1 ÷ contribution margin as a share of revenue. Set a stricter target when profit or cash flow is tight.[14][15][16]
Assess added spend separately. Marginal ROAS is added revenue divided by added spend.[14] Apply these thresholds only after the conversion window has matured and reporting lag no longer explains the drop.
Signals for Each Budget Decision
| Decision | Decision threshold and checks | Budget action |
|---|---|---|
| Hold | CPA meets your limit, contribution profit meets target, incremental ROAS exceeds break-even, and cash flow supports spending; confirm you have enough conversions | Keep the baseline unchanged |
| Reduce | Added spend repeatedly misses the allowable CPA or incremental-ROAS target; compare mature incremental spend with the baseline and exclude incomplete attribution periods | Trim the inefficient increment while keeping profitable delivery |
| Reallocate | The current tier’s incremental return is below target; check sample size, overlap, and cash-flow limits | Shift only what the stronger tier can absorb without pushing CPA above target; keep a comparison baseline |
Base decisions on several full conversion cycles - not one bad day. Log each budget change, its date, the affected tier, the attribution window, and the threshold for the next review. High-ROAS tiers with low volume need more testing before a major reallocation.[14]
If the baseline stays healthy, test broader reach without changing it.
Testing Broader Lookalikes Without Changing the Baseline
Keep the original setup as your control and fund one broader-range test separately. Run controlled A/B tests with comparable budgets to isolate the effect of audience breadth.[17][18][20]
Set the test’s CPA or contribution-profit threshold before launch. Then wait for enough conversions and mature attribution before judging the results. Increase spend gradually, and only when conversion volume, cash flow, and marginal profit support it.[4][14][19]
Use the result to plan the next budget move rather than replacing the baseline right away.
Your Next Lookalike Budget Decision
Once attribution has had time to settle, separate reporting noise from actual demand before changing spend. Compare Meta-reported revenue with backend sales before treating a ROAS drop as lost demand.[21]
If revenue has fallen, use unit economics to decide whether to hold, reduce, or reallocate spend. Rising CPA paired with more refunds or a lower purchase rate is a stronger warning than CPA alone. Let contribution margin and cash flow guide the next budget move - not platform ROAS.
When those signals conflict, Dancing Chicken can audit the account and analyze the data to pinpoint the issue.
FAQs
How can I tell audience saturation from delayed conversions?
Check frequency and reach in Ads Manager. Frequency above 7.0, paired with reach that’s leveling off, points to audience saturation. Meta is struggling to find new, high-quality users within your defined audience.
If reach keeps growing and frequency stays low - typically below 3.0 to 4.0 - low immediate sales are more likely tied to delayed conversions. People are engaging with your ads, but they’re taking longer to buy.
How do I compare lookalikes with uneven spending?
Keep lookalike ad sets similar in structure and budget range so you can compare them using ROAS and CPA - not just volume. As budgets increase, watch for declining ROAS. Check frequency and reach plateaus for signs of audience saturation.
Combine overly fragmented ad sets to help Meta spend more efficiently, and move a larger share of the budget to the best-performing lookalike.
When should rising acquisition costs trigger a budget cut?
Cut your budget when acquisition costs consistently exceed your profit margins or keep you from hitting your target return on ad spend (ROAS). If cost per acquisition (CPA) rises without better conversion rates, higher customer lifetime value, or revenue growth, your spending isn’t scaling efficiently.
Watch for audience saturation: ad frequency above 3–4 or sharp drops in click-through rate. When these metrics worsen while costs climb, reduce spending to protect profitability.


