How to Measure Lead Quality in Meta Ads Audience Tests
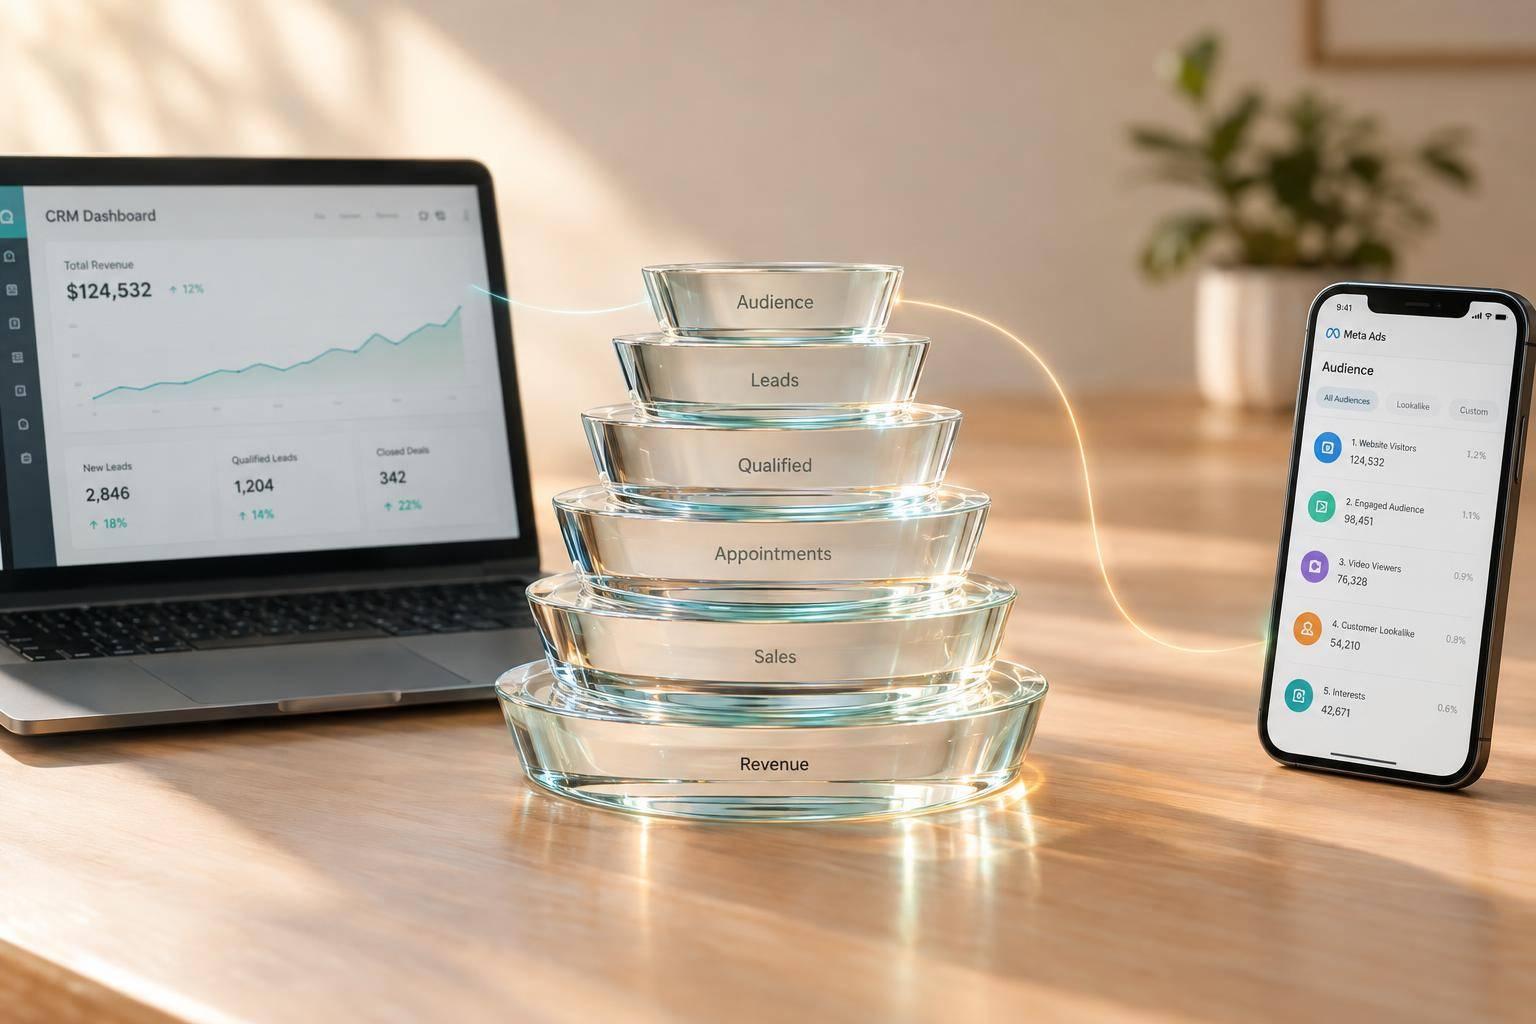
How to Measure Lead Quality in Meta Ads Audience Tests
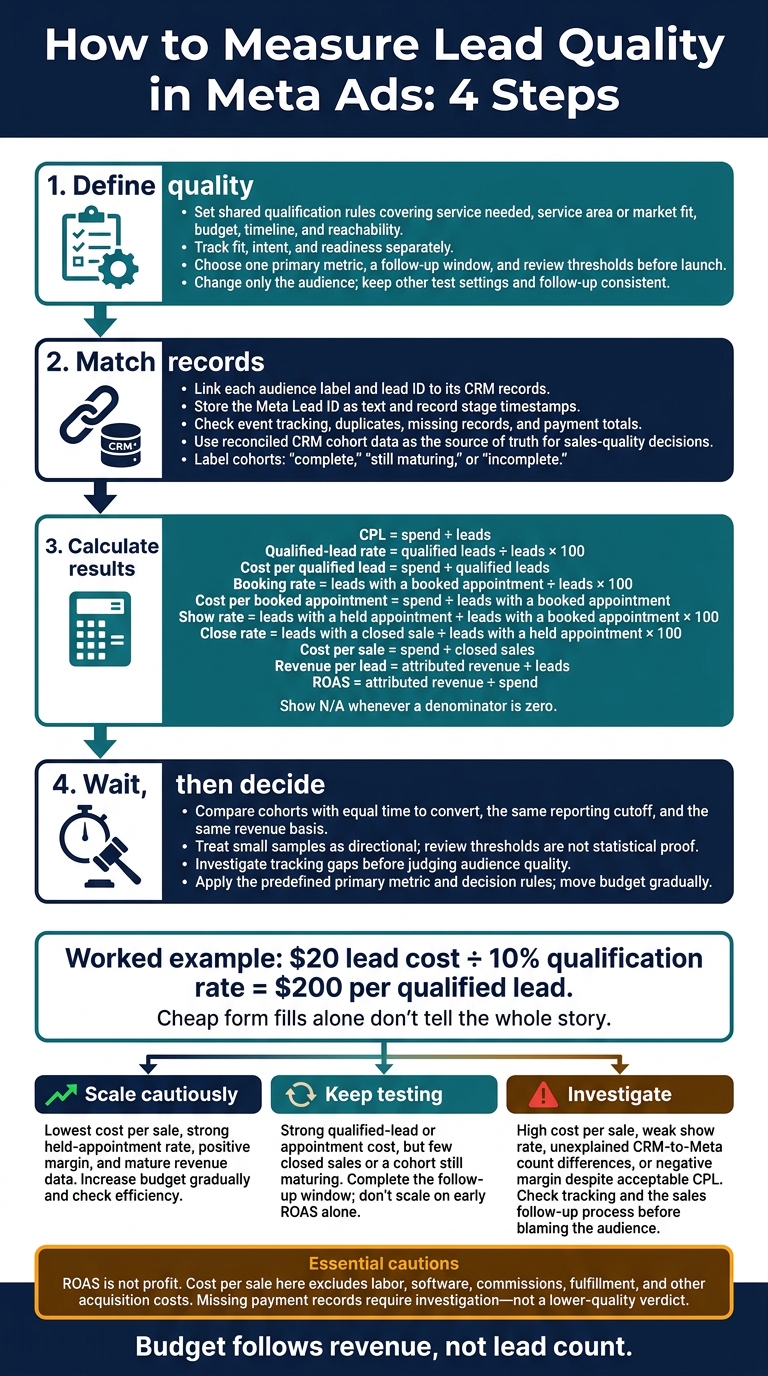
The best Meta Ads audience isn’t always the one with the cheapest leads. Measure lead quality by linking each audience’s leads to CRM records, then comparing qualification rates, appointment costs, closed sales, and revenue.
Use these four steps to decide where budget should go:
- Define quality. Set the same qualification rules, sales stages, primary metric, and follow-up window for every audience. Keep other test settings the same.
- Match records. Keep audience labels and lead IDs in the CRM. Check event tracking, duplicates, missing records, and payment totals.
- Calculate results. Compare cost per qualified lead, booked appointment, and sale, plus revenue per lead and ROAS. Check margins, too - ROAS isn’t profit.
- Wait, then decide. Compare groups with equal time to convert. Treat small samples as directional, investigate tracking gaps, and move budget gradually.
For example, a $20 lead cost with a 10% qualification rate means $200 per qualified lead. Cheap form fills alone don’t tell the whole story.
How to Measure Lead Quality in Meta Ads: 4 Steps
1. Set Lead Quality Standards and Test Rules
Start with a shared definition of lead quality.
Define Qualified Leads and Sales Stages
Have marketing and sales approve a written checklist covering the service needed, service area or market fit, budget, timeline, and whether the lead is reachable. Log the evidence, decision, owner, and date in the CRM. Track fit, intent, and readiness separately so a prospect who fits but isn’t ready to buy doesn’t get mislabeled.
Define each sales stage: lead received, contact attempted, contacted, qualified, appointment booked, appointment held, proposal sent, closed sale, and revenue collected. A booking must have a date and time. A held appointment requires attendance.
Count reschedules once, and remove duplicate records using a CRM contact ID, email, phone number, or another approved identifier. Specify how repeat purchases count within the revenue window. Keep disqualified records and their reasons, and report cancellations, no-shows, and refunds separately.
Choose Your Main Metric and Reporting Window
Choose one primary metric. Use cost per qualified lead when sales data is limited. Once you have enough data from later sales stages, use cost per booked appointment, held appointment, or closed sale - or revenue return.
Set an acquisition-cost ceiling based on margins and unit economics. Define the minimum number of outcomes needed before making decisions. These are review thresholds, not statistical proof. Report uncertainty and label results from small samples as directional.
Document test dates, attribution rules, the revenue window, and the final sales-data cutoff. Use U.S. date formatting (MM/DD/YYYY) and one time zone, such as Eastern Time. Credit outcomes using one rule - lead creation date or another single cutoff - and apply it to every audience.
Give the last leads the same follow-up window as the first. Before testing, set criteria for scaling, continuing the test, or investigating results. Apply these rules across audiences when comparing cost per lead, appointments, sales, and revenue.
Keep Other Test Settings Consistent
Change only the audience. Keep the objective, optimization event, offer, ad content, placements, budget method, bid strategy, form, qualification questions, and follow-up process the same.
Give each audience its own identifier in Meta and the CRM. Use Meta’s controlled A/B testing tools where available to separate test groups.[1] Record audience-expansion settings and exclusions at launch.
For standard ad sets, document overlap, uneven spend, and delivery limits. Treat these comparisons as observational, not controlled. Link each audience to its CRM records to track sales outcomes under the same test rules.
sbb-itb-db0d145
2. Link Meta Audiences to CRM Sales Records
Once the test is live, tie every lead’s CRM record to its audience cell.
Record Lead IDs, Audience Labels, and Stage Dates
Store the Meta Lead ID as text, along with your internal lead ID, audience label, campaign/ad set/ad IDs, form name, placement, UTMs, and submission timestamp. For website leads, carry the source, medium, campaign, content, and term parameters through form submission and CRM creation. Keep the original submission timestamp and give each later stage its own timestamp.
Track when qualification, booking, attendance, closing, payment, cancellation, and refunds occur. Match records using normalized email addresses and phone numbers, but keep the original values. Log the match method and confidence, too. Keep exact ID matches separate from inferred matches so a shared phone number doesn’t assign revenue to the wrong audience.
Send CRM Events Through the Conversions API
Map CRM stages to events your current integration supports. Send the original lead event and each stage update daily or as they occur. Include the lead identifiers, exact event timestamp, and correct action source.
Send the Meta Lead ID unhashed, and hash customer identifiers where required. To deduplicate browser and server copies of the same action, use the same event name and event ID.
Review rejected events, collect required consent, send only the data needed, and restrict access. Event delivery alone doesn’t make an account eligible for Conversion Leads. Check the current requirements separately.
Reconcile Lead Counts and Revenue
Before comparing audiences, reconcile Meta leads with CRM records, sales, and payments. Check missing IDs, unmatched records, duplicates, delayed updates, invalid dates, and double-counted sales. If a lead is linked to multiple cells, apply the attribution rule you defined earlier and keep the underlying exposure records.
Expect CRM cohort totals to differ from Ads Manager. Attribution windows, reporting dates, time zones, matching, and delayed events can all cause differences. Use CRM cohort data as the source of truth for sales-quality decisions.
Keep contracted revenue separate from collected cash, refunds, and net collected revenue. Record all amounts in USD. Label each audience complete, still maturing, or incomplete based on reconciliation, sales-cycle maturity, and missing records.
Missing payment records call for a tracking investigation - not a lower-quality verdict. These reconciled records feed the audience cost and revenue comparison in the next step.
3. Compare Audience Costs and Sales Results
Once you’ve reconciled the CRM data, rank audiences by sales outcomes - not lead volume. Use the same follow-up window, reporting cutoff, and revenue basis for every audience cell.
Build the comparison from your CRM cohort export using the metrics below.
Calculate Lead and Appointment Metrics
Use a stable lead ID to count each lead once at booking and once at attendance.
CPL = spend ÷ leads
Qualified-lead rate = qualified leads ÷ leads × 100
Cost per qualified lead = spend ÷ qualified leads
Booking rate = leads with a booked appointment ÷ leads × 100
Cost per booked appointment = spend ÷ leads with a booked appointment
Show rate = leads with a held appointment ÷ leads with a booked appointment × 100
Calculate Sales Costs and Revenue Returns
Close rate = leads with a closed sale ÷ leads with a held appointment × 100
Cost per sale = spend ÷ closed sales
Revenue per lead = attributed revenue ÷ leads
ROAS = attributed revenue ÷ spend
Show N/A whenever a denominator is zero. Cost per sale here excludes labor, software, commissions, fulfillment, and other acquisition costs. And ROAS is not profit.
Read these metrics together. No single number should decide the winner.
Decide Whether to Scale, Keep Testing, or Investigate
Apply the primary metric and review thresholds you chose before launch. A completed follow-up window doesn’t make results conclusive when sales are few.
| Decision | Supporting result pattern | Next action |
|---|---|---|
| Scale cautiously | Lowest cost per sale, strong held-appointment rate, positive margin, and mature revenue data | Increase budget gradually and check whether efficiency stays stable. |
| Keep testing | Strong qualified-lead cost or appointment cost, but few closed sales or a cohort that’s still maturing; revenue and margin aren’t yet conclusive | Complete the follow-up window and collect more comparable outcomes. Don’t scale on early ROAS alone. |
| Investigate | High cost per sale, weak show rate, unexplained CRM-to-Meta count differences, or negative margin despite acceptable CPL | Check response time, contact attempts, booking process, attendance, sales follow-up, duplicate records, attribution, and revenue status before blaming the audience. |
Conclusion: Allocate Audience Spend Based on Sales Outcomes
Before moving budget, compare cohorts at the same maturity stage with the same qualification rules and reconciled CRM records. Use your CRM cohort export and primary metric to favor the audience that delivers the best sales results: the lowest cost per qualified lead, booked appointment, and closed sale, plus the highest revenue or ROAS. Check margins before making the shift, if that data is available.
Document the budget change, the sales results supporting it, and the next review date. Move budget gradually, then review the next mature cohort using the same cutoff rules. For a deeper review, contact Dancing Chicken for a Meta Ads audit or revenue-focused lead-generation strategy. Budget follows revenue, not lead count.
FAQs
How many qualified leads do I need to compare audiences?
There’s no fixed minimum. Each test needs enough volume for the platform to learn and produce statistically meaningful results. Focus on segment quality, not just lead counts. Use reliable tracking to connect leads to booked appointments, closed sales, and revenue.
Test one variable at a time. Review performance trends over 2–3 weeks, then adjust or remove segments that aren’t performing well.
How can I link sales to audiences without a CRM integration?
Give each campaign and ad its own UTM parameters in your ad URLs. Track website conversions with the Meta Pixel and Conversions API, and use a shared identifier, such as an order ID, to link events to sales records.
Export performance data from Meta Ads Manager regularly, then match it against payment records using those identifiers. Use the same reporting timeframes across data sources to calculate revenue by audience segment.
Which audience should I favor if sales costs and revenue conflict?
Put more budget toward the audience with the highest contribution profit: net revenue minus fulfillment costs, payment fees, and ad spend. Lead volume and platform-reported ROAS can paint the wrong picture. Give more weight to confirmed payment records and actual revenue than to ad platform metrics alone.
If results are still unclear or costs stay high, check your tracking, offer, and ad content to find the problem before shifting your budget.